Mastering Table Design in PowerPoint: A Step-by-Step Guide
Introduction
Design is a very important part of any presentation in Microsoft PowerPoint. This includes how you format tables in PowerPoint so that they align with the message that you are trying to send.
The Best Free Plugin for PowerPoint Tables – Learn More
To quickly insert a new table in a powerpoint presentation, users must first select the number of columns and rows, then add the table which is presented in the standard blue fill colors. We think that users can achieve so much more from their presentations by formatting tables in a few easy steps.
In this guide, we will cover the following topics:
- Creating and Importing Tables
- Understanding the Table Design Tab
- Designing Your Table
- Formatting Your Table
- Advanced Table Techniques
- PowerPoint Table Best Practices and Tips
- Conclusion

Creating and Importing Tables
As we briefly mentioned in the introduction, creating and importing an entire table in a PowerPoint file is a very straight forward process. Here is an outline of each step involved:
Selecting Rows and Columns using Drag and Drop
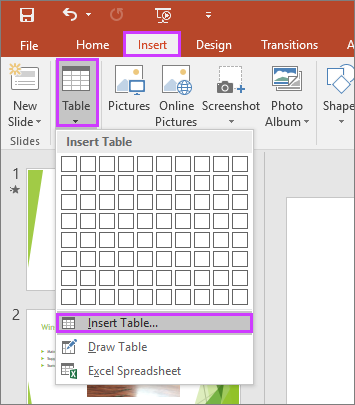
Create a table by selecting the number of rows and columns from the drag-and-drop menu via the Insert tab, from which you then select Table. This is our favourite method, as it allows for easy table layout customization right from the beginning. You can simply choose the table cells that you need.
Specifying Rows and Columns to Add
The next best method is to add a table by specifying the exact number of rows and columns via the Insert tab, then select Table, and click Insert Table. This method provides a bit more control over the table’s structure, as you can then type in the number of rows and columns (a.k.a. table size).
Drawing a Table
To draw a table you need to create it in the current slide. Go to Insert -> Table -> Draw Table. Once a table has been generated, you can make further edits to a drawn table via the Layout tab. This is a bit manual and tricky to use, which is why we usually recommend one of the methods previously mentioned above.
Creating a Table from an Excel Spreadsheet
Users can also create a table from an Excel spreadsheet. Simply go to Insert -> Table -> Excel Spreadsheet. From here an Excel spreadsheet will open where you can enter data in to an Excel table. This will then link to a table on your PowerPoint slide. Again, it's a bit cumbersome to use, so we usually don't recommend this method for users.
Copying and Pasting a Table
You can also copy and paste a table directly from an Office app such as Word, Excel, or another PowerPoint presentation. This method is quick and easy, but it can come with some table formatting options and challenges that mean you spend more time fixing your tables in PowerPoint.
Perfect PowerPoint Tables Every Time – Learn More
Understanding the Table Design Tab
Navigating the Table Design Tab
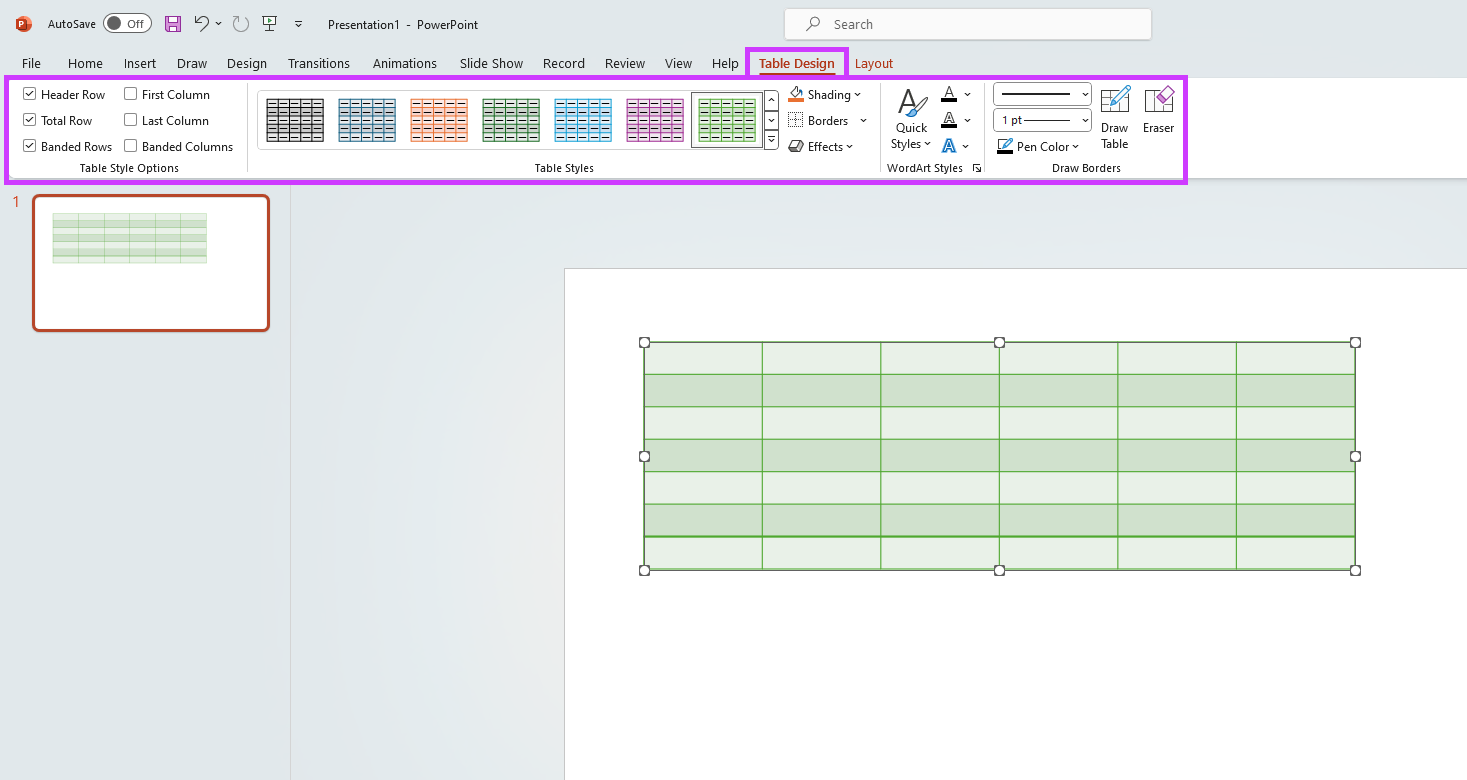
This tab is one of the most important formatting elements in the whole of PowerPoint because it gives users many design options. Within this tab, Table Styles Options is one of the most commonly used options to select a style for tables in PowerPoint, which we'll look at next.
Table Style Options Group
The Table Style Options group allows you to customize the look of your table. You can choose from various built-in table styles, including the No Style, No Grid option, which is the closest thing to no style at all. Users can also format specific items within a table, such as the header row or banded rows using this group. It is a quick and easy way to format tables in PowerPoint based on your requirements.
Table Styles Group
PowerPoint table styles are based on Office themes, making it easy to maintain consistency. You can start with a PowerPoint table style and remove or add formats as needed, or start from scratch and explore different styles. This is another easy way to format the whole table or even an individual cell to get the right formatting that you are after (e.g. line style).

Designing Your Table
Applying Table Styles
Users can apply a built-in table design in PowerPoint to create a professional-looking table. You can choose from various built-in table styles, including the No Style, No Grid option, which is the closest thing to no style at all. Again, refer to the Table Design Tab to find and apply the right theme colors to your entire table.
Autofit Columns and Evenly Space Columns
Users can autofit columns in PowerPoint tables to make sure they are evenly distributed using the plugin PPT Productivity. In fact, most users say that it helps to save time when they adjust column widths in their PowerPoint tables.
Ensure Accurate Tables in PowerPoint – Learn More
Formatting Your Table
This section looks at the Layout Tab where users can format tables in many different ways. Here we go:
Merging and Splitting Cells
The Split Cells option in the Layout tab can be used to split cells. Similarly, you can select multiple cells to merge and use Merge Cells to combine them. This is a really useful feature if you have a more complex table, as it allows you to effectively change the cell size in your tables.
Combining Shapes with Tables
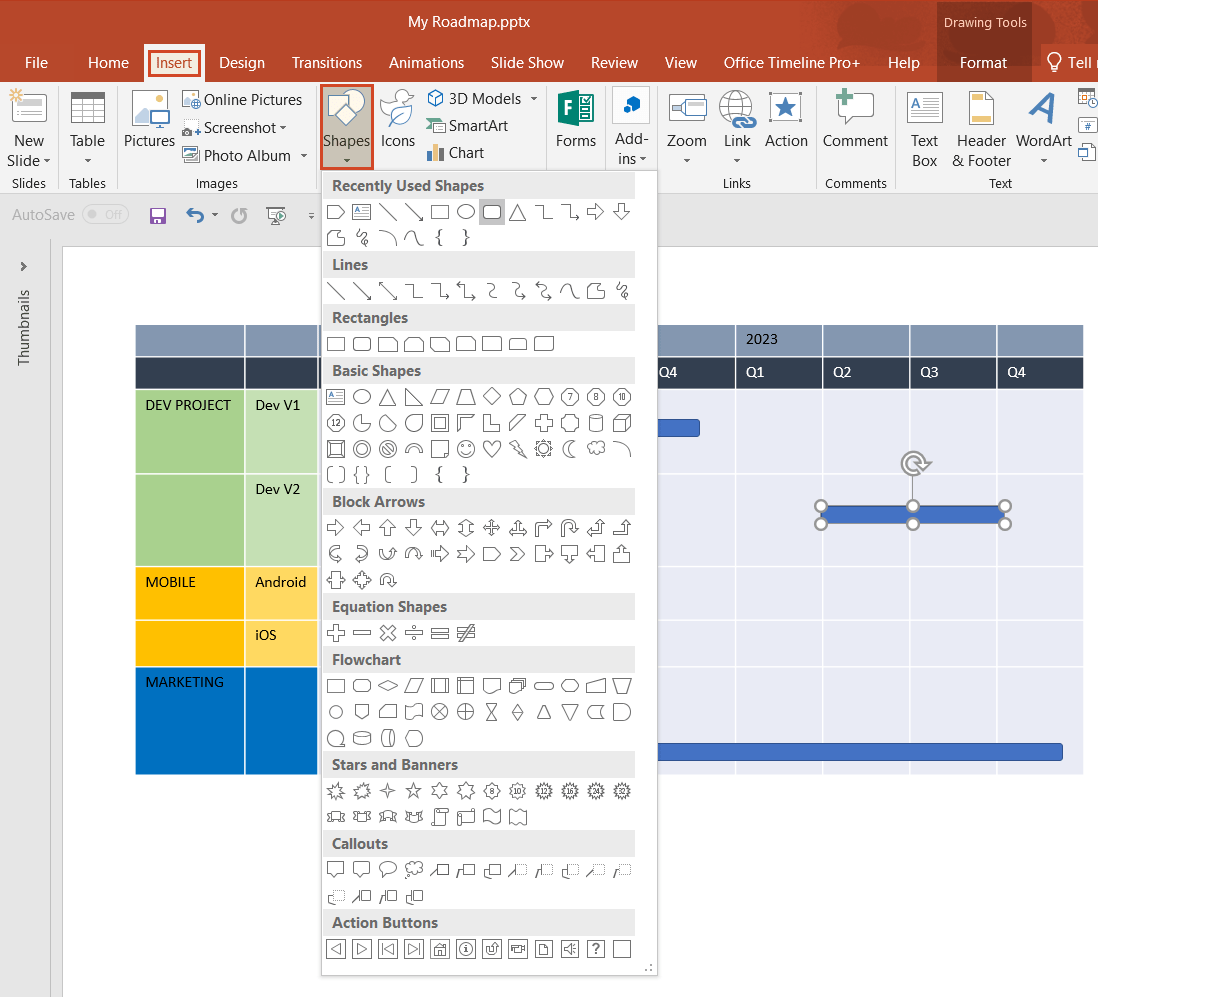
With PowerPoint plugins users can also add shapes in to tables, such as embedding harvey balls or arrows pointing in a specific direction to your tables. Based on our experience, these PowerPoint shapes enhance the aesthetics of your tables, which result in a more engaged audience.
Aligning Shapes over Tables
Again, users can align shapes over a PowerPoint table with specific plugins such as PPT Productivity. This has a similar effect to what we previously described in the abovementioned paragraph.

Advanced Table Techniques
Tweaking Table Styles in PowerPoint
You can tweak a built-in style to customize any table to your needs. Changing a built-in table style is easy and quick, and can help you achieve the desired look for your presentation. For example, users can look to add different color options through the Table Design -> Table Styles -> Shading tabs. Many users tweak tables so that they are aligned to the themes of their organization.
Using Table Stripes and Status Indicators
Users can also add row stripes to a PowerPoint table with plugins like PPT Productivity. This is similar to the use of PowerPoint shapes to enhance the design of tables in powerpoint.
Check Your PowerPoint Table Totals – Learn More
PowerPoint Table Best Practices and Tips
Here are our top three tips for anyone working with PowerPoint tables, as follows:
1. Use Clear and Simple Formatting
When designing tables in PowerPoint, clarity and simplicity should be your top priorities. Ensure that your table is easy to read by using clear and concise headings for rows and columns. Avoid clutter by minimizing the use of excessive text or unnecessary elements. Opt for a simple color scheme and consistent font styles to maintain a clean look.
Utilize PowerPoint’s table design options to apply consistent formatting across the entire table. For example, use table styles to quickly apply a professional look that includes consistent fonts, borders, and shading, and ensure that your table design tab is used to adjust these elements uniformly.
2. Enhance Readability
Make your table more readable by leveraging PowerPoint’s table formatting features. Use features like banded rows to make the data easier to scan and distinguish. Incorporate bold headings and larger font sizes for key columns or rows to draw attention to important information.
Apply table styles from the Table Design tab to ensure that your table has a consistent and polished appearance. Additionally, use the format painter tool to quickly copy and apply formatting from one part of the table to another, maintaining uniformity throughout your table.
3. Data Visualization
Enhance the effectiveness of your table by integrating data visualization elements. In PowerPoint, you can use charts or graphs alongside your table to visually represent data and highlight key trends or comparisons. This approach helps your audience grasp complex information more easily.
For example, you might use a bar chart to show changes over time or a pie chart to illustrate proportions. Additionally, consider using conditional formatting to apply visual cues such as color gradients or data bars directly within the table cells, providing immediate visual context for your data.

Conclusion
Effective table design is crucial for enhancing the clarity and impact of your PowerPoint presentations. By carefully formatting tables to align with your message, you ensure that your data is not only presented clearly but also supports your overall narrative.
From selecting the right number of rows and columns to applying consistent formatting and advanced techniques, mastering these aspects will elevate the quality of your presentations.
Check Your PowerPoint Tables, Without Excel – Learn More
.png)
.png)

